


Whether you are a diehard baseball fan or a newly established fan of the game, we all have those moments when we see unknown stats come across our screens at home and wonder: “What does that mean?”
Baseball is a game of statistics, and this page will explain (almost) all of them—at least the ones you’ll see most often.
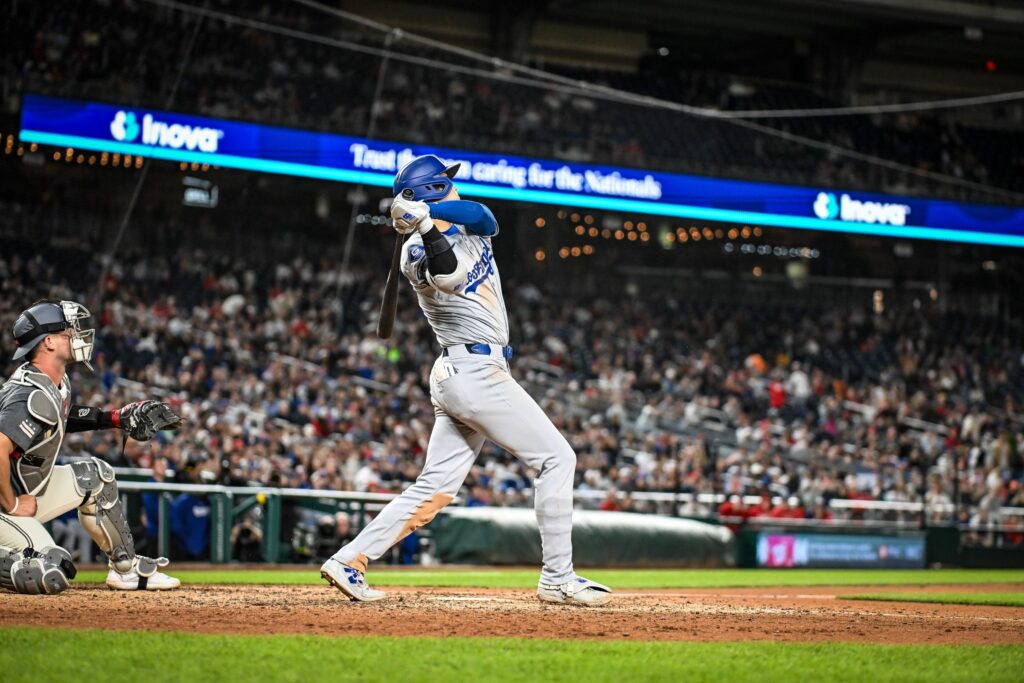
Hitting Stats
These measure how well a player hits the ball, gets on base, and brings in runs.
AVG – Batting Average (Hits/At-Bats)
The percentage of a player’s at-bats that result in a hit.
Example: If a batter gets 25 hits in 100 at-bats, he hits .250, meaning he records a hit once in every four at-bats.
OBP – On-Base Percentage (Hits + Walks + Hit By Pitch) / (At-Bats + Walks + Hit By Pitch + Sacrifice Fly)
This calculates how often a player reaches base through a hit, walk, or hit-by-pitch, accounting for sacrifice flies.
Example: A high OBP signifies that a player is good at getting on base, whether by a hit, a walk or a hit-by-pitch.
SLG – Slugging Percentage (Total Bases/At-Bats)
Measures a hitter’s power by calculating total bases per at-bat. Singles count as one base, doubles as two, triples as three, and home runs as four.
Example: A high slugging percentage signifies that a batter is a power hitter.
OPS – On-Base Plus Slugging (OBP + SLG)
Adds OBP and SLG together to give a quick measure of a player’s ability to get on base and hit for power.
Example: .380 OBP + .520 SLG = .900 OPS. In today’s game, .800 is good, .900 is great, 1.000 is excellent. Shohei Ohtani’s 2026 OPS was .889, 4th-highest in the league.
OPS+ – Adjusted OPS Plus
Adjusts OPS for league and ballpark effects. A score of 100 is league average; 120 is 20% better than average; 150 is 50% better.
Example: Higher is better. Because OPS+ adjusts for ballparks, a hitter who plays half his games at Coors Field in Denver, Colorado, the highest-elevation park in Major League Baseball, gets his numbers scaled down to account for the thin air.
In most Major League broadcasts, the ones you see the most are AVG, OBP, SLG, and OPS.
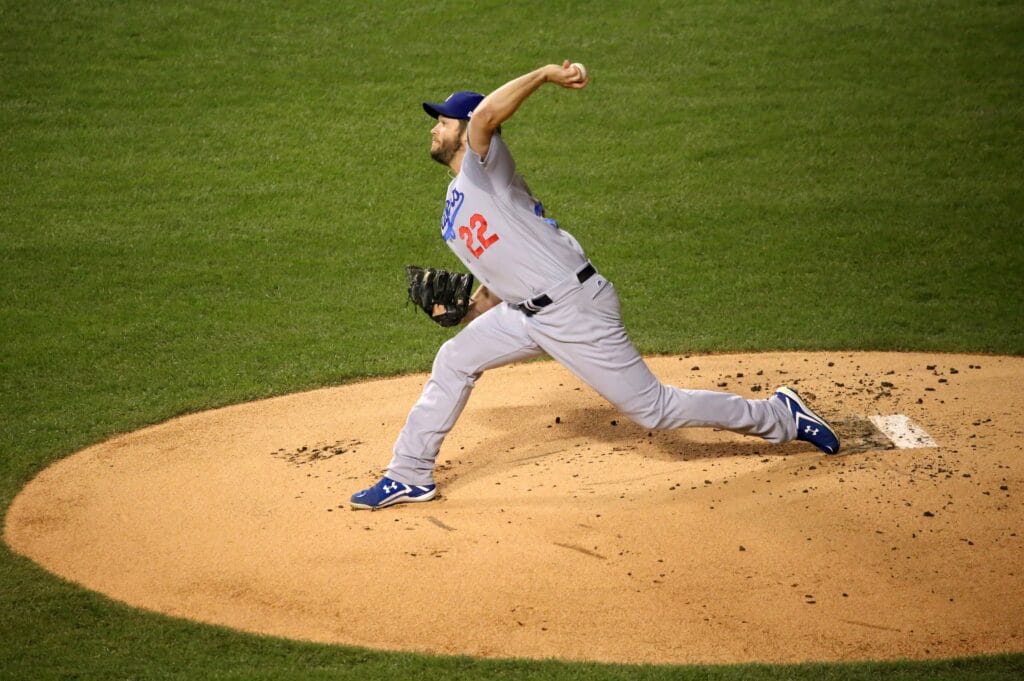
Pitching Stats
These help coaches and fans determine how well a pitcher prevents runs, gets outs, and limits baserunners.
ERA – Earned Run Average (Earned Runs x 9 / Innings Pitched)
This is the average number of earned runs a pitcher allows per nine innings.
Example: If a pitcher allows 20 earned runs in 60 innings, his ERA would be 3.00. In MLB, an ERA below 3.00 is generally considered excellent.*
- A pitcher can also be charged with runs after leaving the game: If he exits with runners on base and those inherited runners later score, the runs are charged to him rather than the relief pitcher.
WHIP – Walks Plus Hits per Inning Pitched (Walks + Hits) / (Innings Pitched)
This measures how many hits and walks a pitcher allows per inning. Hit batters are not included.
Example: The lower the better. A WHIP below 1.20 is considered good, below 1.00 is excellent.
K/9 – Strikeouts per Nine Innings (Strikeouts x 9 / Innings Pitched)
This measures how many batters a pitcher strikes out (K) over the equivalent of nine innings.
Example: A good K/9 would be 9.0+ with 10.5+ being excellent. The higher the better.
BB/9 – Walks per Nine Innings (Walks x 9 / Innings Pitched)
This measures how many batters a pitcher walks (BB) over the equivalent of nine innings. Very similar to K/9.
Example: A good BB/9 would be under 2.7 with under 2.0 considered to be excellent.
FIP – Fielding Independent Pitching
Estimates pitching performance based primarily on strikeouts, walks, hit batters, and home runs, reducing the influence of fielders.
Example: Lower is better. It helps determine whether a pitcher’s ERA reflects their underlying performance or factors outside their control. A pitcher with a 3.80 ERA but a 2.90 FIP has likely been unlucky and could improve.
Wins (W) and Losses (L) – Wins and Losses are games credited to the winning and losing pitcher, respectively.
Wins and losses can definitely be misleading. A pitcher can throw a great game and lose because their team doesn’t score, or pitch poorly and still earn a win. A starting pitcher must throw at least five complete innings in a standard nine-inning game to be credited with a win.
Example: More wins, obviously, is better. The game’s best pitchers typically rack up double-digit wins, and baseball’s all-timers will sometimes record 20 or more.*
- Former Oakland A’s pitcher Bob Welch recorded the most wins over the last 50 seasons when he notched 27 wins in 1990.
For the complete list of baseball stats officially used by Major League Baseball, click here.
For more stories like this, follow Dodgers Dynasty on Instagram and Facebook.